
User login
Language
Anonymous's groups in this site
User is not a member of any group.
Your groups across all your sites
User is not a member of any group.
Recent Content
Who's online
There are currently 0 users online.
You are here
Climate change: New U.S. map shows how climate change affects U.S. counties
Primary tabs
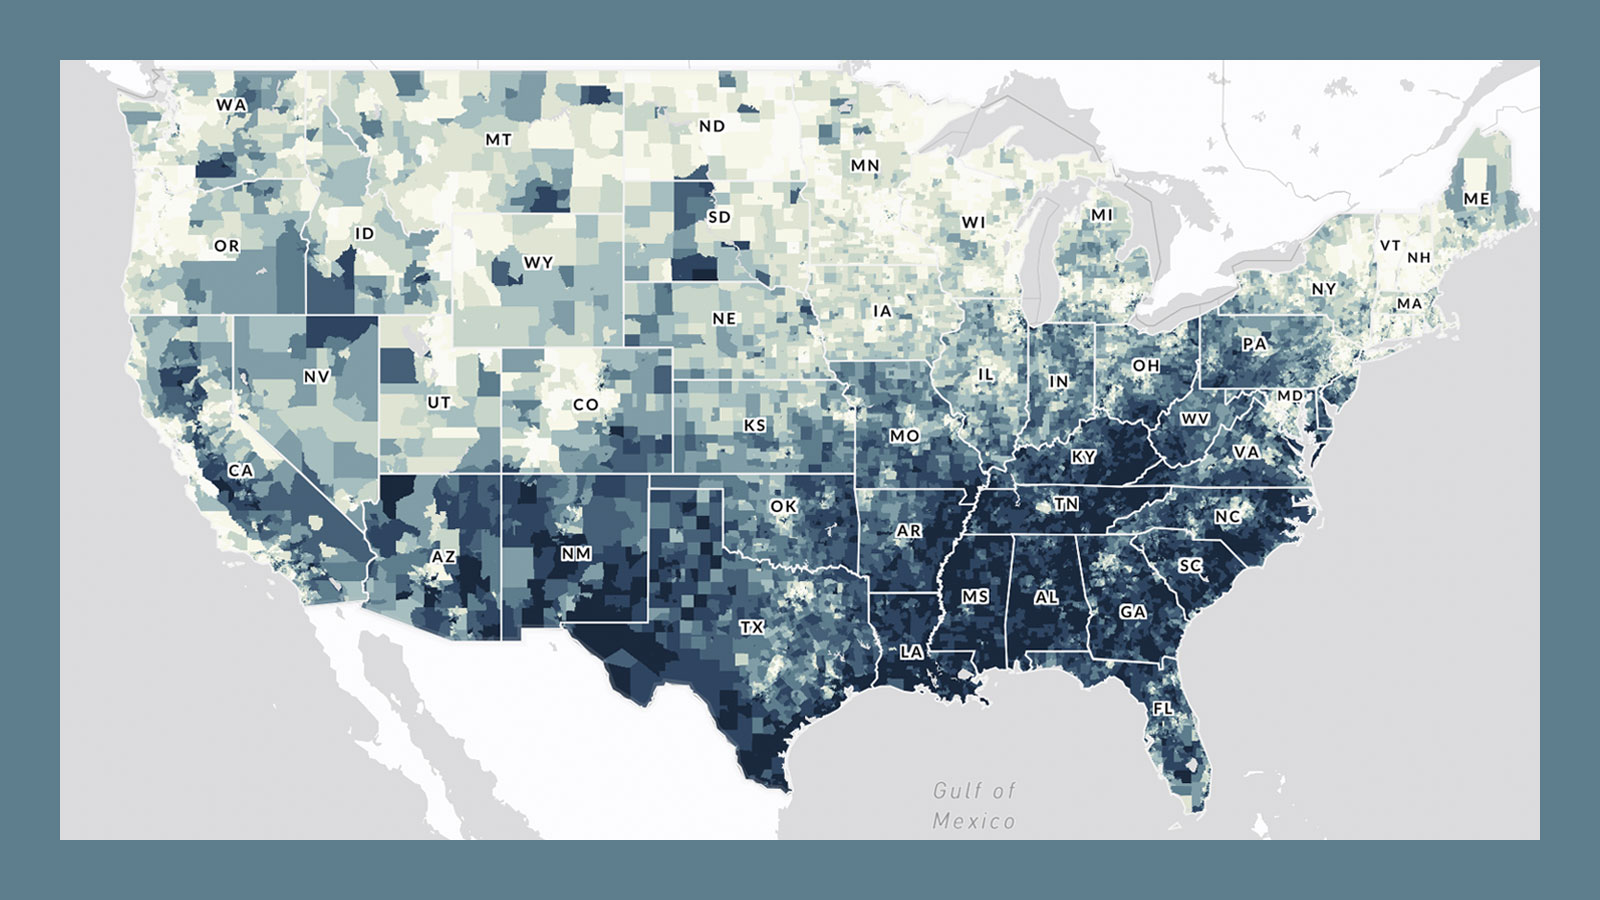
The most detailed interactive map yet of the United States’ vulnerability to dangers such as fire, flooding, and pollution was released on Monday by the Environmental Defense Fund and Texas A&M University.
The fine-grained analysis spans more than 70,000 census tracts, which roughly resemble neighborhoods, mapping out environmental risks alongside factors that make it harder for people to deal with hazards. Clicking on a report for a census tract yields details on heat, wildfire smoke, and drought, in addition to what drives vulnerability to extreme weather, such as income levels and access to health care and transportation.
The “Climate Vulnerability Index” tool is intended to help communities secure funding from the bipartisan infrastructure law and the Inflation Reduction Act, the landmark climate law President Joe Biden signed last summer. An executive order from Biden’s early months in office promised that “disadvantaged communities” would receive at least 40 percent of the federal investments in climate and clean energy programs. As a result of the infrastructure law signed in 2021, more than $1 billion has gone toward replacing lead pipes and more than $2 billion has been spent on updating the electric grid to be more reliable.
...
Click article for maps


Recent Comments